A great new technological step for wildlife conservation efforts comes in the form of a map. The Gap Analysis Program (GAP), which is itself a program under the umbrella of the US Geological Survey, makes it’s mission to “keep common species common.” Essentially, the objective of the program is to maintain that species not (yet) threatened by extinction don’t end up reaching an endangered species list, an issue often deprived of much-needed attention in light of it’s preventative nature. It takes a different track to keep policy makers (and anyone for that matter) informed than traditional conservation efforts which generally maintain species-by-species data, by instead maintaining information about regions and landscapes (which in turn allow those who will want to manipulate them a better idea of what they’d be doing).
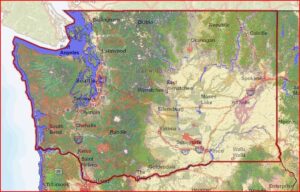
A Level 3 Image of Washington State using the GAP Viewer
These efforts recently culminated in a national land cover viewer (and accompanying data set) that combines several important relevant data-sets into one easily accessible package. To be more particular, it combines the following:
– The Southwest Regional Gap Analysis project (2004)
– The Southeast Regional Gap Analysis Project (2007)
– The Northwest Regional Gap project
– The updated California Gap project (2009)
– The Landfire Project (for all remaining regions)
The coherent land cover map that was produced as a result is particularly important as it gives scientists a basis for creating “predictive models of wildlife distribution and biodiversity across large geographic areas” which in turn are used by policy-makers in determining which regions should be avoided as population density increases and new residential/commercial areas have to be demarcated (GAP Land Cover Viewer).
To prevent information overload, users of the data can specify the level of detail they need for their own particular projects. Further, they can choose to use the online viewer or download the relevant data-sets, selectable by region, in either ESRI GRID format or ERDAS IMAGINE, depending on which Geographic Information Systems (GIS) tool’s they’re employing. All-in-all, a very versatile project is now available for those with need, and those simply curious.